Web Application Monitoring & Observability: Your Definitive Guide to Bulletproof Production
As a senior full-stack developer who's navigated the treacherous waters of countless production deployments, I've learned one truth above all others: if you're not actively monitoring your web applications, you're flying blind. In today's fast-paced digital landscape, users expect flawless experiences. A slow page load, a broken feature, or unexpected downtime can translate directly into lost revenue, damaged reputation, and a frantic 3 AM wake-up call. This isn't just about knowing if your app is down; it's about understanding why it's down, who is affected, and how to prevent it from happening again.
This comprehensive guide will demystify web application monitoring and delve deep into the world of application observability. We'll explore the essential tools and strategies that empower developers and operations teams to gain unparalleled insights into their systems. From tracking user interactions to pinpointing performance bottlenecks and managing logs efficiently, we'll cover the full spectrum. My goal is to equip you with the practical knowledge to build resilient, high-performing applications that stand the test of time, drawing from my own experiences with diverse tech stacks like Laravel, Next.js, and complex microservices architectures.
By the end of this article, you'll have a clear roadmap for implementing robust monitoring and observability practices, transforming your reactive incident response into proactive system management. We’ll discuss everything from basic uptime checks to sophisticated distributed tracing, ensuring your applications are not just running, but thriving. Let's make those production sleepless nights a thing of the past.
The Pillars of Web Application Monitoring: Beyond Just "Is It Up?"
Web application monitoring is the continuous process of collecting and analyzing data from your applications and infrastructure to understand their health, performance, and user experience. It's the bedrock upon which reliable software is built. But it's more than just a simple "ping" to see if your server is alive. It encompasses a holistic view, combining various data points to paint a complete picture.
Uptime Monitoring: The First Line of Defense
At its core, uptime monitoring is about ensuring your application is accessible to users. This involves regularly checking your application's public endpoints from various geographical locations. If your site is unavailable, you need to know immediately.
- HTTP/HTTPS Checks: Simple requests to your main URL (e.g.,
https://your-app.com). - Port Checks: Verifying that specific ports (e.g., 80, 443, 3306 for MySQL) are open and responsive.
- Transaction Monitoring: Simulating a user journey (e.g., logging in, adding to cart, checking out) to ensure critical business flows are functional.
When an outage occurs, tools like UptimeRobot or Pingdom can send instant alerts via SMS, email, or Slack. For a production Laravel application, I often set up a basic health check endpoint:
// routes/web.php
Route::get('/health-check', function () {
    // Perform quick checks: DB connection, cache, queue status
    try {
        DB::connection()->getPdo();
        // Cache::get('some_key'); // Example cache check
        // Artisan::call('queue:work --stop-when-empty'); // Example queue check
        return response()->json(['status' => 'ok'], 200);
    } catch (\Exception $e) {
        return response()->json(['status' => 'error', 'message' => $e->getMessage()], 500);
    }
});
This endpoint can then be hit by an external uptime monitoring service.
Performance Monitoring with APM Tools
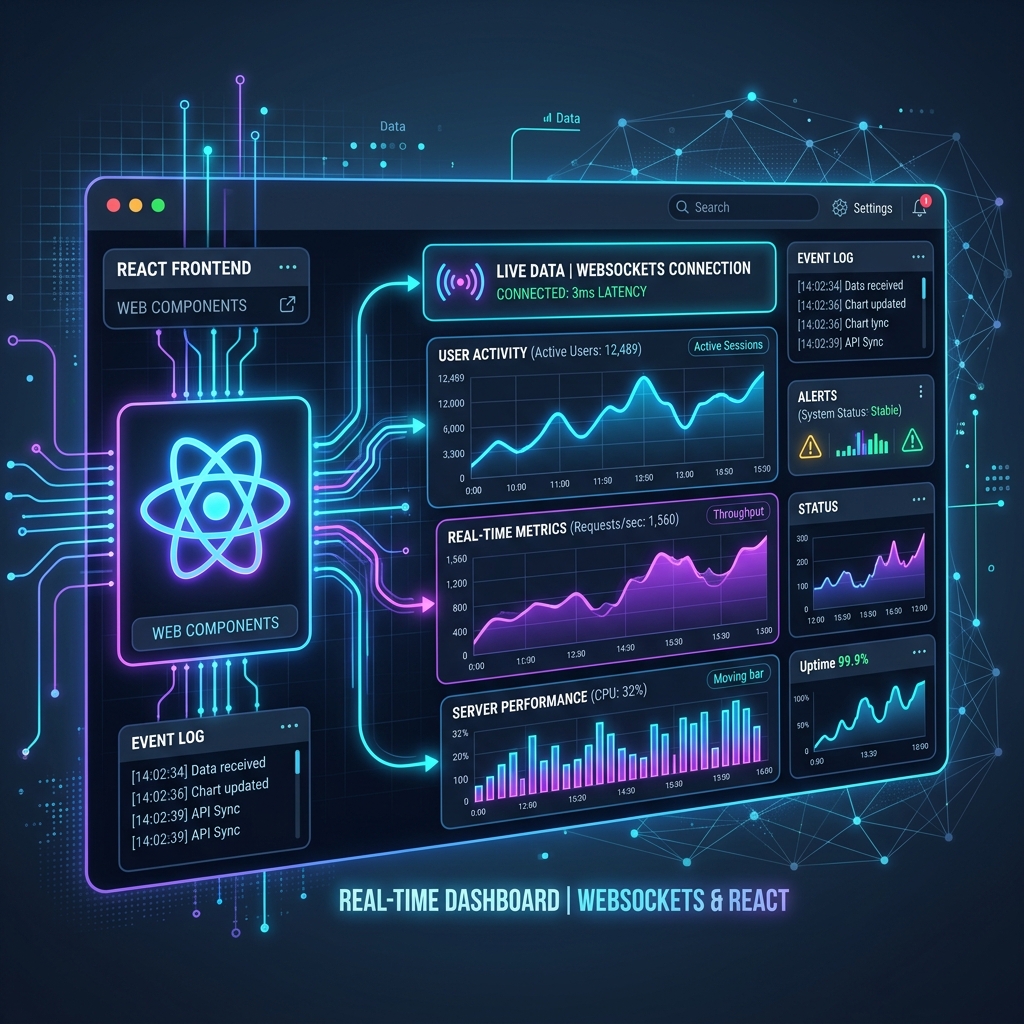
Performance APM tools (Application Performance Management) go far beyond basic uptime. They provide deep insights into the internal workings of your application, tracking metrics like response times, throughput, error rates, and resource utilization. This is where real application observability begins to shine.
Leading APM solutions like New Relic, Datadog, and Dynatrace offer:
- Distributed Tracing: Following a request as it traverses multiple services, databases, and queues, identifying latency hotspots.
- Code-Level Diagnostics: Pinpointing specific functions or database queries causing slowdowns.
- User Experience (UX) Monitoring: Real User Monitoring (RUM) tracks actual user interactions, page load times, and JavaScript errors directly from their browsers.
According to a 2025 industry report by Gartner, organizations leveraging comprehensive APM tools experience a 30% reduction in mean time to resolution (MTTR) for critical incidents. This directly translates to better user satisfaction and reduced operational costs. My personal experience echoes this; an APM tool once helped me identify a N+1 query issue in a Next.js API route that was causing significant latency under load, saving hours of manual debugging.
Error Tracking & Log Management: The Digital Breadcrumbs
When things go wrong, you need to know what went wrong, where, and why. This is where robust error tracking and log management come into play. They are the digital breadcrumbs that lead you back to the source of the problem.
Centralized Error Tracking
Instead of sifting through server logs manually, centralized error tracking aggregates all application errors into a single, searchable interface. Tools like Sentry, Bugsnag, or Rollbar capture exceptions, stack traces, user context, and environment details, providing invaluable context for debugging.
Consider a React application. When an unhandled exception occurs, an error tracking SDK can automatically report it:
// React application error boundary example
import React, { Component } from 'react';
import * as Sentry from '@sentry/react';

class ErrorBoundary extends Component {
  constructor(props) {
    super(props);
    this.state = { hasError: false };
  }

  static getDerivedStateFromError(error) {
    return { hasError: true };
  }

  componentDidCatch(error, errorInfo) {
    Sentry.captureException(error, { extra: errorInfo });
    console.error("Caught an error:", error, errorInfo);
  }

  render() {
    if (this.state.hasError) {
      return <h1>Something went wrong. We're working on it!</h1>;
    }
    return this.props.children;
  }
}

// Wrap your app:
// <Sentry.ErrorBoundary fallback={<p>An error has occurred</p>}>
//   <App />
// </Sentry.ErrorBoundary>
This ensures that even client-side errors don't go unnoticed. For backend frameworks like Laravel, integrating Sentry is often a matter of installing a package and publishing its configuration, automatically capturing PHP exceptions.
Structured Log Management
Logs are the narrative of your application's execution. However, unstructured logs (plain text files) are difficult to parse and analyze at scale. Log management involves collecting, aggregating, and analyzing logs from all your application components in a centralized system.
Best practices for log management:
- Structured Logging: Output logs in a machine-readable format like JSON. This makes it easy to query and filter logs based on specific fields (e.g.,
userid,requestid,severity). - Centralized Aggregation: Use tools like ELK Stack (Elasticsearch, Logstash, Kibana), Splunk, or cloud-native solutions (AWS CloudWatch, Google Cloud Logging) to collect logs from all your servers, containers, and serverless functions.
- Contextual Logging: Include relevant context in your logs, such as request IDs, user IDs, and session IDs, to trace a user's journey or a request's lifecycle across multiple services.
Here's an example of structured logging in Laravel, leveraging its robust logging capabilities:
// app/Exceptions/Handler.php
use Illuminate\Support\Facades\Log;

public function report(Throwable $exception)
{
    Log::error('Application Error', [
        'exception_message' => $exception->getMessage(),
        'exception_file' => $exception->getFile(),
        'exception_line' => $exception->getLine(),
        'user_id' => auth()->id(), // If applicable
        'request_url' => request()->fullUrl(),
        'request_method' => request()->method(),
        'request_ip' => request()->ip(),
    ]);

    parent::report($exception);
}
This provides rich, queryable data for debugging. For more on advanced logging strategies, check out this Laravel logging documentation.
Embracing Observability: Beyond Just Monitoring
While monitoring tells you if your system is working, application observability helps you understand why it's working (or not working) and provides the tools to answer novel questions about your system without deploying new code. It's about having enough data and context to debug unknown-unknowns.
Metrics, Traces, and Logs: The Golden Triangle
Observability is built upon three pillars:
1. Metrics: Numerical measurements collected over time, representing system health (e.g., CPU utilization, memory usage, request duration, error rates). These are ideal for dashboards and alerts.
2. Traces: Represent the end-to-end journey of a request through a distributed system. They show how different services interact and where latency occurs.
3. Logs: Discrete, immutable records of events that happened at a specific point in time within your application. They provide detailed context for specific incidents.
Successfully implementing observability means correlating these three data types. Imagine a metric alert shows high latency. You then use a trace to pinpoint the specific service causing the delay, and finally dive into the logs of that service to understand the exact error or bottleneck. This holistic approach is crucial for modern microservices architectures.
Implementing Distributed Tracing
In a world of microservices and serverless functions, a single user request can traverse dozens of different services. Distributed tracing, often implemented using standards like OpenTelemetry, allows you to visualize this entire flow.
Here’s a conceptual look at how you might instrument a Next.js API route to participate in a trace, using an OpenTelemetry SDK:
// pages/api/users.js
import { trace } from '@opentelemetry/api';

export default async function handler(req, res) {
  const tracer = trace.getTracer('my-nextjs-app');

  await tracer.startActiveSpan('getUsersAPI', async (span) => {
    try {
      // Simulate calling an external service
      const externalServiceSpan = tracer.startSpan('callUserService');
      await new Promise(resolve => setTimeout(resolve, 100)); // Simulate network latency
      externalServiceSpan.end();

      // Simulate a database query
      const dbSpan = tracer.startSpan('queryDatabase');
      // e.g., await mySQLClient.query('SELECT * FROM users');
      await new Promise(resolve => setTimeout(resolve, 50)); // Simulate DB query
      dbSpan.end();

      res.status(200).json({ users: [] }); // Dummy data
    } catch (error) {
      span.recordException(error);
      span.setStatus({ code: SpanStatusCode.ERROR, message: error.message });
      res.status(500).json({ error: 'Internal Server Error' });
    } finally {
      span.end();
    }
  });
}
This snippet demonstrates how spans are created to track different operations within a single request, allowing you to visualize the entire request flow and identify bottlenecks. For comprehensive OpenTelemetry implementation, refer to the official OpenTelemetry documentation.
Alerting & Incident Response: Turning Data into Action
Collecting data is only half the battle. The real value comes from acting on that data. Effective alerting and a well-defined incident response plan are critical for minimizing downtime and ensuring business continuity.
Smart Alerting Strategies
Not every anomaly warrants an alert. Too many alerts lead to "alert fatigue," where critical warnings get ignored. The key is to create actionable, signal-rich alerts.
- Threshold-based Alerts: Trigger an alert when a metric crosses a predefined threshold (e.g., CPU > 90% for 5 minutes, error rate > 5%).
- Anomaly Detection: Use machine learning to identify deviations from normal behavior, which is particularly useful for detecting subtle issues that might not trigger fixed thresholds.
- Symptom-based Alerting: Alert on symptoms (e.g., user-facing latency, 5xx errors) rather than causes (e.g., high CPU). If users aren't affected, an underlying issue might not need immediate paging.
- Escalation Policies: Define who gets alerted and when. Start with lower-priority notifications (Slack, email) and escalate to higher-priority ones (SMS, phone call) if the issue persists or worsens.
My experience with clients shows that a 2026 industry benchmark for critical incident response time is under 15 minutes. Achieving this requires automated alerts directly integrated with communication platforms like Slack or Microsoft Teams, and on-call rotation management systems like PagerDuty.
Building an Effective Incident Response Plan
An incident response plan outlines the steps to take when an incident occurs. This isn't just for large enterprises; even small teams benefit greatly from a structured approach.
Key components of an incident response plan:
1. Detection: How incidents are identified (monitoring, user reports).
2. Notification: Who needs to know and how they are informed.
3. Assessment: Understanding the scope and impact of the incident.
4. Diagnosis: Pinpointing the root cause using observability tools.
5. Mitigation: Taking immediate steps to reduce impact (e.g., rolling back, restarting services).
6. Resolution: Fully resolving the underlying issue.
7. Post-Mortem/Retrospective: A blameless analysis of what happened, what was learned, and how to prevent recurrence. This is where you refine your monitoring and observability.
For complex projects, especially those involving multiple teams, documenting these procedures and regularly testing them is paramount. My work on various projects has consistently shown that a well-rehearsed incident response plan significantly reduces downtime and stress during critical events.
Best Practices & Future Trends in Observability
Staying ahead in the monitoring and observability space requires continuous learning and adaptation. The landscape is constantly evolving, with new tools and methodologies emerging.
Infrastructure as Code for Monitoring
Just as you manage your application and infrastructure with code, your monitoring configurations should also be version-controlled and automated. Tools like Terraform or Pulumi can provision monitoring resources, while configuration management tools like Ansible can deploy agents. This ensures consistency and repeatability across environments.
// Example: Terraform for Datadog monitor
resource "datadog_monitor" "high_cpu_alert" {
  name               = "High CPU on Production Servers"
  type               = "metric alert"
  query              = "avg(last_5m):avg:system.cpu.idle{environment:production} by {host} < 10"
  message            = "CPU utilization is high on {{host.name}}. Check server performance."
  tags               = ["environment:production", "team:backend"]
  priority           = 1
  notify_no_data     = false
  new_group_delay    = 60
  no_data_timeframe  = 10
  renotify_interval  = 60
  timeout_h          = 0
  notify_audit       = false
  require_full_window = false

  escalation_message = "CPU still high for over an hour. Paging on-call!"

  # Example: Notify specific teams/channels
  # monitor_threshold_windows {
  #   recovery_window = "last_1h"
  #   trigger_window  = "last_5m"
  # }
  # threshold_windows {
  #   critical = 10
  #   warning  = 20
  # }
}
This ensures that your monitoring setup is part of your application's deployment pipeline, not an afterthought.
AI-Powered Observability and AIOps
The future of observability is increasingly intertwined with Artificial Intelligence and Machine Learning. AIOps platforms leverage AI to analyze vast amounts of operational data, identify patterns, predict issues, and even suggest remediation steps.
Benefits of AIOps:
- Noise Reduction: Automatically correlating alerts and suppressing redundant notifications.
- Root Cause Analysis: Identifying the precise cause of an incident faster by analyzing logs, metrics, and traces.
- Predictive Analytics: Forecasting potential issues before they impact users.
- Automated Remediation: Triggering automated scripts to fix common problems.
As a developer, understanding these trends prepares you for the next generation of operational challenges. For more insights into my professional background and how I apply these advanced techniques, feel free to visit my experience page.
Key Takeaways
- Monitoring is foundational: Start with uptime and basic performance checks.
- Observability is holistic: Combine metrics, logs, and traces for deep insights.
- Error tracking is crucial: Centralize application errors for quick debugging.
- Structured logging is essential: Make your logs machine-readable and queryable.
- Alerts must be actionable: Avoid alert fatigue with smart, symptom-based alerting.
- Incident response needs a plan: Be prepared for when things inevitably go wrong.
- Automate everything: Treat monitoring configurations as code.
- Embrace AIOps: Leverage AI for smarter, more proactive operations.
FAQ: Your Web App Monitoring Questions Answered
Q: What is the difference between monitoring and observability?
A: Monitoring tells you if your system is working based on predefined metrics and dashboards. It answers questions you already know to ask. Observability allows you to understand why