Mastering Sub-100ms API Response Times: A Full-Stack Developer's Playbook
As a seasoned full-stack developer, few things are as satisfying as witnessing your application respond with lightning speed. In today's hyper-connected world, users expect instant feedback. A sluggish API isn't just an inconvenience; it's a direct threat to user engagement, conversion rates, and ultimately, your business's bottom line. Studies from 2025 indicate that a mere 100-millisecond delay in API response can decrease conversion rates by an average of 7%, while a 2-second delay often leads to abandonment rates exceeding 50%. This isn't just theory; it's a hard truth I've observed across countless projects, from high-traffic e-commerce platforms to real-time analytics dashboards.
API response time optimization isn't a luxury; it's a fundamental requirement for any modern web application aiming for success. Achieving sub-100ms response times consistently requires a holistic approach, touching every layer of your stack – from the database to the front-end. It's about identifying bottlenecks, implementing intelligent caching, optimizing database queries, and streamlining your application logic. This isn't a "set it and forget it" task; it's an ongoing commitment that demands deep understanding and meticulous execution.
In this comprehensive guide, I'll walk you through the practical strategies and battle-tested techniques I've employed over my experience to achieve fast API performance. We'll dive deep into backend optimizations, database wizardry, and network considerations, providing actionable insights and code examples across popular frameworks like Laravel, Next.js, and React. My goal is to equip you with the knowledge to not just reduce API latency, but to consistently deliver an exceptional user experience that keeps your users coming back for more.
---
The Anatomy of API Latency: Where Do Those Milliseconds Go?
Before we can optimize, we must understand. API latency is the total time taken for a request to travel from the client to the server, be processed, and for the response to travel back. It's a sum of several components.
Network Overhead: The Unseen Tax
Even with fiber optics, data still takes time to travel. This includes DNS resolution, TCP handshake, SSL/TLS negotiation, and the actual data transfer. While often out of direct application control, choosing geographically appropriate server locations (CDNs, edge computing) and optimizing payload sizes can significantly mitigate this.
- DNS Resolution: The time it takes to translate a domain name into an IP address. Using fast DNS providers and DNS caching can help.
- TCP Handshake & SSL/TLS Negotiation: Establishing a secure connection adds a few round trips. HTTP/2 and HTTP/3 (QUIC) can reduce this by multiplexing requests over a single connection and offering faster handshakes.
- Payload Size: Larger request/response bodies mean more data to transfer. Consider efficient data serialization (e.g., Protobuf over JSON for internal services), compression (Gzip), and pagination.
Server-Side Processing: The Core of Your Application
This is where your application logic lives and breathes. It includes routing, authentication, authorization, business logic execution, data fetching from databases or other services, and response serialization. This is typically where most of your optimization efforts will be focused.
- Application Logic Execution: Inefficient algorithms, excessive loops, or synchronous blocking operations can hog CPU cycles. Profile your code to identify hotspots.
- External Service Calls: Calls to third-party APIs, microservices, or external caches add significant latency. Implement timeouts, retries, and asynchronous patterns where possible.
- Resource Contention: If your server is under-provisioned or poorly configured, CPU, memory, or I/O contention can severely impact performance.
Database Interaction: The Common Bottleneck
The database is often the slowest component in many applications. Inefficient queries, missing indexes, or a poorly designed schema can easily push your response times into the hundreds of milliseconds. This area demands meticulous attention. We'll explore strategies like database query optimization and how to fix the infamous N+1 query problem.
---
Database Query Optimization: The Foundation of Speed
Your database is the heart of your application's data. A poorly optimized database is like a clogged artery, restricting the flow of information and crippling your API's performance.
Indexing Strategies: Your Database's GPS
Indexes are crucial for fast data retrieval. They allow the database to quickly locate rows without scanning the entire table. Think of them as the index in a book – you don't read the whole book to find a topic.
- When to Index:
- Columns frequently used in
WHEREclauses. - Columns in
JOINconditions. - Columns in
ORDER BYorGROUP BYclauses. - Foreign key columns.
- Avoid Over-Indexing: While indexes are great for reads, they add overhead to writes (inserts, updates, deletes) as the index also needs to be updated. Analyze your query patterns.
- Composite Indexes: For queries involving multiple columns in
WHEREclauses, a composite index can be highly effective. The order of columns in the composite index matters.
Example (MySQL/PostgreSQL):
-- Create an index on 'email' for faster user lookups
CREATE INDEX idx_users_email ON users (email);

-- Create a composite index for faster order lookups by customer and status
CREATE INDEX idx_orders_customer_status ON orders (customer_id, status);
Eliminating the N+1 Query Problem
The N+1 query problem is a classic performance killer, especially prevalent in ORM (Object-Relational Mapping) heavy applications like those built with Laravel or Ruby on Rails. It occurs when an application executes one query to retrieve a list of parent records, and then executes N separate queries (one for each parent) to fetch associated child records.
Problematic Scenario (Laravel Eloquent):
// Imagine fetching 100 posts, and then for each post, fetching its author
$posts = App\Models\Post::all(); // 1 query
foreach ($posts as $post) {
    echo $post->author->name; // 100 queries (1 for each post's author)
}
// Total: 101 queries!
The Fix: Eager Loading
Eager loading allows you to load related models at the same time as the primary model, typically using a JOIN or separate SELECT statements behind the scenes, reducing N+1 queries to just 2 or 3.
Solution (Laravel Eloquent):
// Eager load the 'author' relationship
$posts = App\Models\Post::with('author')->get(); // 2 queries (1 for posts, 1 for authors)
foreach ($posts as $post) {
    echo $post->author->name; // No additional queries here!
}
// Total: 2 queries!
This simple change can dramatically improve fast API performance, especially when dealing with large collections of related data.
Query Optimization Best Practices
-
SELECT *is a no-go: Only select the columns you actually need. This reduces the amount of data transferred over the network and processed by the database. - Avoid Subqueries where Joins are Better: Often,
JOINoperations are more efficient than subqueries, especially for larger datasets, as they allow the database to optimize the execution plan better. - Use
LIMITandOFFSETfor Pagination: Crucial for APIs returning lists of resources. - Analyze Slow Queries: Use
EXPLAIN(in MySQL/PostgreSQL) or similar tools to understand how your database executes a query and identify bottlenecks. - Database Connection Pooling: Reusing existing database connections instead of establishing a new one for every request reduces overhead.
---
Caching Strategies: Your First Line of Defense
Caching is arguably the most impactful strategy for reducing API latency. It involves storing frequently accessed data in a faster, temporary storage layer closer to the application or client. When a request comes in, the system first checks the cache; if the data is present (a "cache hit"), it's returned immediately, bypassing slower operations like database queries or complex computations.
Types of Caching
- Client-Side Caching (Browser/CDN): Leverages browser's cache or Content Delivery Networks (CDNs) for static assets or data that changes infrequently. Setting appropriate
Cache-Controlheaders is key. - Application-Level Caching (In-memory/Distributed):
- In-memory: Using libraries like
APC,OpCache(PHP), or simple in-application data structures. Fastest but limited to a single server's memory. - Distributed: Using external services like Redis or Memcached. Scalable across multiple servers, ideal for sharing cache data.
- Database Caching: Some databases have built-in query caches, but these are often less effective for dynamic data. A more robust approach is using a dedicated caching layer in front of the database.
Implementing Caching with Redis
Redis is an in-memory data structure store, used as a database, cache, and message broker. Its speed makes it perfect for caching strategies API.
Example (Laravel with Redis):
First, ensure Redis is installed and configured. Then, you can cache query results:
use Illuminate\Support\Facades\Cache;

function getPopularProducts()
{
    $products = Cache::remember('popular_products', $ttl = 60 * 60, function () {
        // This callback will only execute if 'popular_products' is not in cache
        return App\Models\Product::where('is_popular', true)
                                  ->orderBy('views', 'desc')
                                  ->limit(10)
                                  ->get();
    });

    return $products;
}
In a Node.js/Next.js environment, you might use a Redis client library:
// Example using ioredis in Node.js
const Redis = require('ioredis');
const redis = new Redis(); // Connects to localhost:6379 by default

async function getCachedUserData(userId) {
  const cacheKey = `user:${userId}`;
  let userData = await redis.get(cacheKey);

  if (userData) {
    console.log('Cache hit!');
    return JSON.parse(userData);
  }

  console.log('Cache miss, fetching from DB...');
  // Simulate fetching from database
  const user = await fetchUserFromDatabase(userId);

  if (user) {
    await redis.set(cacheKey, JSON.stringify(user), 'EX', 3600); // Cache for 1 hour
  }
  return user;
}
Cache Invalidation Strategies
This is the trickiest part of caching. Stale data can be worse than slow data.
- Time-Based Expiry (TTL): Data expires after a set time. Simple, but can lead to temporary staleness.
- Event-Driven Invalidation: Invalidate cache entries when the underlying data changes (e.g., update a product, clear its cache entry).
- "Cache-Aside" Pattern: Application code is responsible for reading from and writing to the cache, and for invalidating cache entries.
---
Optimizing Backend Application Logic
Beyond the database and caching, the code you write directly impacts API response time optimization. Clean, efficient code and smart architectural choices are paramount.
Efficient Code and Algorithms
- Profile Your Code: Use tools like Xdebug (PHP), Node.js
perf_hooks, or Go'spprofto identify CPU-intensive sections of your code. Focus optimization efforts where they have the most impact. - Asynchronous Operations: Don't block the main thread waiting for I/O operations (e.g., external API calls, file system access). Use promises, async/await, or message queues.
- Batch Processing: Instead of making many individual calls, batch operations where possible (e.g., batch inserts into a database, sending multiple notifications in one go).
Microservices vs. Monolith: A Performance Perspective
While microservices offer scalability and team autonomy, they introduce their own performance challenges:
- Increased Network Latency: More inter-service communication means more network hops.
- Distributed Transactions: Can be complex and add overhead.
- Observability: Tracing requests across multiple services is harder.
For sub-100ms response times, a well-optimized monolith can often outperform a poorly designed microservices architecture due to reduced network overhead. The key is thoughtful design, regardless of architecture. If you're building microservices, ensure robust service discovery, efficient inter-service communication (e.g., gRPC), and vigilant monitoring.
API Gateway Optimization
An API Gateway (like AWS API Gateway, Nginx, Kong, or even a custom Express/Laravel proxy) can perform various optimizations:
- Request/Response Transformation: Reduce payload size.
- Rate Limiting: Protect your backend from overload.
- Caching: Some gateways offer caching capabilities.
- Authentication/Authorization Offloading: Reduces load on your backend services.
---
Frontend Considerations for Perceived Performance
While our focus is on backend API response time, the user's perception of speed is equally important. A fast backend can still feel slow if the frontend isn't optimized. This is where frameworks like Next.js and React shine.
Data Fetching Strategies in React/Next.js
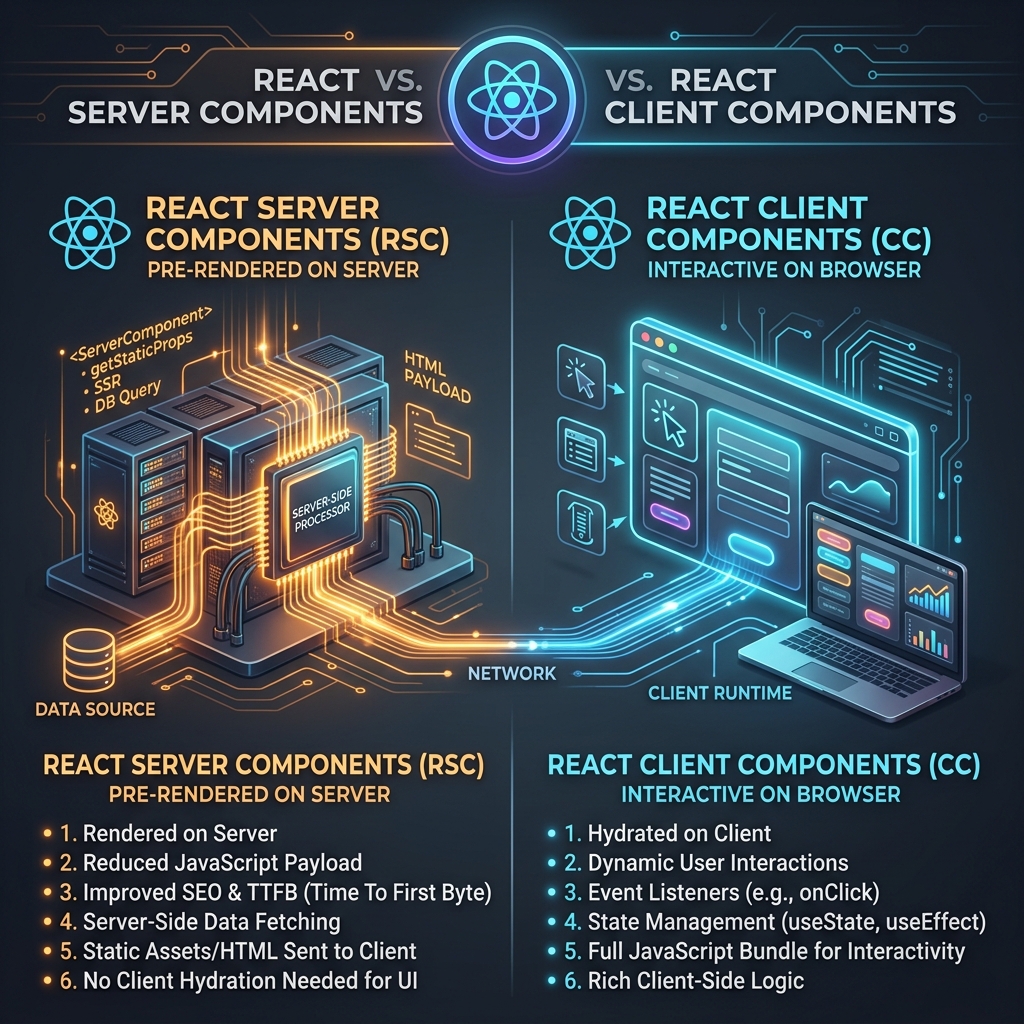
- Server-Side Rendering (SSR) / Static Site Generation (SSG): With Next.js, rendering pages on the server or pre-building them at build time reduces the initial load on the client and the number of API calls needed for the first paint.
-
getServerSideProps(SSR) andgetStaticProps(SSG) in Next.js allow you to fetch data at request time or build time, respectively, before sending the HTML to the client. This dramatically improves perceived load times. - Client-Side Data Fetching with SWR/React Query: For dynamic data, libraries like SWR or React Query provide powerful caching, revalidation, and de-duplication mechanisms, reducing redundant API calls and managing loading states gracefully.
- Optimistic UI Updates: Update the UI immediately after a user action, assuming the API call will succeed. If it fails, revert the UI. This provides instant feedback and significantly improves perceived responsiveness.
Example (Next.js with getServerSideProps):
// pages/products/[id].js
import Head from 'next/head';

export async function getServerSideProps(context) {
  const { id } = context.params;
  const res = await fetch(`https://api.example.com/products/${id}`);
  const product = await res.json();

  if (!product) {
    return {
      notFound: true,
    };
  }

  return {
    props: { product }, // Will be passed to the page component as props
  };
}

function ProductDetail({ product }) {
  return (
    <div>
      <Head>
        <title>{product.name}</title>
      </Head>
      <h1>{product.name}</h1>
      <p>{product.description}</p>
      {/* Render product details */}
    </div>
  );
}

export default ProductDetail;
This ensures the product data is available immediately when the page loads, without a client-side loading spinner.
---
Monitoring and Continuous Improvement
Optimizing for speed isn't a one-time task. It's an ongoing process of monitoring, identifying new bottlenecks, and iterating.
Observability Tools
- APM (Application Performance Monitoring): Tools like New Relic, Datadog, or Sentry can trace requests end-to-end, identify slow database queries, external service calls, and function hotspots.
- Logging: Comprehensive logging, especially with structured logs, helps diagnose issues and understand application behavior.
- Metrics: Monitor key performance indicators (KPIs) like average response time, p95/p99 latency, error rates, and resource utilization (CPU, memory, I/O).
Load Testing
Before deploying to production, simulate high traffic loads to identify breaking points and ensure your optimizations hold up under pressure. Tools like JMeter, K6, or Locust are invaluable here.
---
Key Takeaways
- Holistic Approach: Optimization spans database, backend logic, caching, and network.
- Database First: Focus on indexing, efficient queries, and eliminating N+1 problems.
- Cache Aggressively: Implement application-level and distributed caching (e.g., Redis) with smart invalidation.
- Profile Your Code: Identify and optimize CPU-intensive sections.
- Eager Loading is Your Friend: Always use it for related data in ORMs.
- Frontend Matters: Use SSR/SSG and client-side caching to enhance perceived performance.
- Monitor Continuously: Performance is a moving target; use APM tools and load testing.
---
FAQ: Optimizing API Response Time
Q1: What is a good API response time?
A: Generally, an API response time under 100ms is considered excellent, providing a near-instant user experience. Between 100ms and 300ms is good, while anything above 500ms starts to feel sluggish to users and can negatively impact engagement and conversion rates.
Q2: How does the N+1 query problem affect API performance?
A: The N+1 query problem significantly increases the number of database queries executed per request. For example, fetching 100 parent records and then making 100 separate queries for their associated child records results in 101 database calls instead of just 2 or 3 with eager loading. This drastically increases database load, I/O operations, and overall API latency.